
-
HOW DO I
Apply For
Find
Pay
View
Join
Water Testing

-
RESIDENTS
Health & Wellness
Senior & Assisted Living
Environment
Families & Individual Support
Financial Assistance
Library
Safety & Justice
Broadband
-
BUSINESS
Community Development
GIS Mapping
Landfill
Ordinances
Requests For Proposals
Start A Business
Zoning, Planning & Land Information
Broadband
-
VISITORS
Campgrounds & Shelters
Downtown Guide
Hunting & Fishing
Parks/Facilities
Explore La Crosse
-
YOUR GOVERNMENT
County Board
Ordinances
Resolutions
Elections
Elected Officials
State
Federal
Facilities
Municipalities: Cities, Villages and Towns
School Districts

Safety Performance Measures for the Highway Safety Improvement Program (HSIP)
![]()
The Highway Safety Improvement Program (HSIP) is a Federal-aid program designed to reduce traffic fatalities and serious injuries on all public roads, including non-State-owned roads and roads on tribal land.
Every state department of transportation (DOT) is required to submit to the Federal Highway Administration (FHWA) a Highway Safety Improvement Program annual report that:
- Describes the progress being made to implement highway safety improvement projects;
- Assesses the effectiveness of those improvements; and,
- Describes the extent to which the improvements have contributed to reducing fatalities and serious injuries on all public roads.
The safety performance analysis in the report describes the state trends in the federal safety performance measures (and others if desired), established targets, the basis for the targets, and how the targets support the State’s Strategic Highway Safety Plan (SHSP) goals. The FHWA evaluates the state HSIP reports and determines that a State DOT has met or made significant progress toward meeting its safety performance targets when at least four of the targets have been met or the actual outcome is better than the baseline performance. If FHWA determines that a State DOT has not met its targets, then the State DOT must obligate the HSIP funds apportioned in the previous year to only HSIP projects and submit a HSIP implementation plan.
State Targets
WisDOT targets are adjusted from the 2020-2024 baseline to reflect a goal of a 2% reduction in each measure. MnDOT targets for 2026 remain the same as 2024 and 2025 due to not meeting the targets in the subsequent baseline years. Neither WisDOT nor MnDOT achieved the 2025 targets and were not better than the baseline.
WisDOT Highway Safety Improvement Program Performance Targets, 2026
| Safety Performance Measure | 2020-2024 Baseline | 2026 |
| Fatalities: Number of fatalities | 599.0 | 587.0 |
| Fatality Rate: Fatalities per 100 million vehicle miles traveled | 0.930 | 0.911 |
| Serious Injuries: Number of serious injuries | 3,227.6 | 3,163.0 |
| Serious Injury Rate: Serious injuries per 100 million vehicle miles traveled | 5.002 | 4.902 |
| Non-motorized Fatalities and Serious Injuries: Number of non-motorized fatalities and non-motorized serious injuries | 400.4 | 392.4 |
| Source: Wisconsin Department of Transportation. | ||
MnDOT Highway Safety Improvement Program Performance Targets, 2024
| Safety Performance Measure | 2020-2024 Baseline | 2026 |
|---|---|---|
| Fatalities: Number of fatalities | 442.4 | 352.4 |
| Fatality Rate: Fatalities per 100 million vehicle miles traveled | 0.780 | 0.582 |
| Serious Injuries: Number of serious injuries | 1,854.0 | 1,463.4 |
| Serious Injury Rate: Serious injuries per 100 million vehicle miles traveled | 3.264 | 2.470 |
| Non-motorized Fatalities and Serious Injuries: Number of non-motorized fatalities and non-motorized serious injuries | 303.6 | 258.4 |
| Source: Minnesota Department of Transportation. | ||
LAPC has committed to plan and program projects that support the states in achieving their targets.
Local Performance
Fatalities in the planning area in 2024 (6) was higher than the 5-year average from 2020-2024 (5.4), and serious injuries in 2024 (92) was significantly higher than the 5-year average (70.8). In 2020, during the Covid-19 pandemic, the planning area experienced its lowest total of non-motorized fatalities and serious injuries (5) since before 2010. This has continued to increase in 2024 to a total of (14) non-motorized fatalities and serious injuries, much higher than the 5-year average (9) by 55.6%.
The rate (number of occurrences per million vehicle miles traveled) for fatalities, serious injuries, and non-motorized fatalities and non-motorized serious injuries for 2015-2024 are shown in the figure below along with the trends in the moving averages from 2020-2024. From 2015-2019 to 2020-2024, the 5-year averages for the serious injury and non-motorized rates declined 14.5% and 21.1%, respectively.
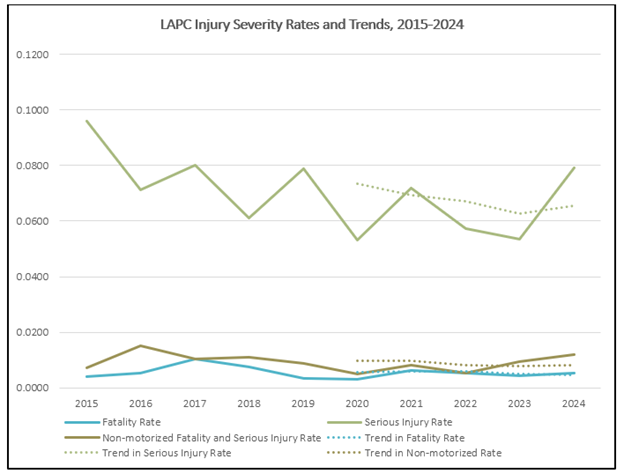
Figure: Injury severity rates and trends, 2015-2024. Rates are calculated using MPA totals and La Crosse County VMT. Data sources: TOPS Lab, UW-Madison, WisDOT and MnDOT websites.
Note: The safety discussion for the planning area was not updated to a baseline of 2021-2025 because vehicle miles traveled in Wisconsin is not available for 2025.
Community Maps

If you want to learn more about crashes in the region and in the state, please visit Community Maps. This tool is hosted at the University of Wisconsin-Madison by the Wisconsin Traffic Operations and Safety (TOPS) Laboratory in collaboration with the Wisconsin Department of Transportation (WisDOT).
© 2026 La Crosse County. All Rights Reserved.